Baby bust in the UK?
Britain’s population issues.

Yesterday (15/05/23), two right-wing English Conservative politicians, Miriam Cates and Suella Braverman, gave talks that referred to the UK’s population problems (as they perceive them) regarding falling birth rates and migration. They prompted me to write this Substack.
Terminology
The Crude birth rate is the number of live births per year per 1,000 population of all ages.
The General Fertility Rate (GFR) is the number of live births per year per 1,000 female population aged 15 to 44.
The Total Fertility Rate (TFR) is the average number of live children that a group of women would bear if they experienced the age-specific fertility rates of the calendar year in question throughout their childbearing lifespan.
The mean (average) age of mother has been standardised to eliminate the impact of changes in the distribution of the population by age, enabling analysis of trends over time. The figure is therefore calculated using fertility rates per 1,000 female population by single year of age.
In 2020, there were fewer births than deaths in the UK for the first time except for a brief period in the mid-1970s. This is a significant reversal – only 10 years ago, births exceeded deaths by more than a quarter of a million. This trend of higher deaths reflects in part the toll of the Coronavirus pandemic – there were approximately an extra 75,000 deaths in 2020. Death rates have now returned to normal levels. However, the number of births was at the lowest level since 2002, reflecting an overall fall in fertility rates since 2012. The Total Fertility Rate (TFR) at 1.58 in 2020 was the lowest on record and is now close to the EU average of 1.5. (Figures 1 and 2).
Figure 1 Total fertility rate in England and Wales (1938-2019)

To understand why fertility is falling, it is helpful to look back at the experience of the early 2000s, when the UK saw a mini baby boom. By 2008 the TFR was more than 1.9 – just below the replacement rate of 2 to 2.1 children per woman, and among the highest in Europe.
This was driven by three main factors:
(a) There was an increase in fertility rates among older (over 30 years) mothers. This has been attributed to social trends and the widespread availability of IVF. In 2019, the standardised mean age of a mother at childbirth was 30.7 years, a figure which has been gradually rising since 1973 when it was 26.4 years. (Figure 3)
(b) Immigration between 1997 and 2004 led to an increase in births as economic migrants settled down and started families. By 2010, more than a quarter of English babies were born to mothers who had been born elsewhere.
(c) There were improvements to financial support for children and childcare provision, especially for low-income mothers.
Figure 2. Highest and lowest fertility rates in England and Wales (2019)

By 2020, all those drivers had been halted or reversed. The increase in fertility for older mothers has only a one-off impact on fertility, which has now largely worked through (and improvements in IVF technology have meant that multiple births are less common). Although immigration has continued, more recent arrivals seem less keen to have children here, and the proportion of births to foreign-born mothers has reduced. There have also been major cuts to the benefit system during the period of austerity during the 2010s, and these cuts were mostly targeted at low-income families. For example, the two-child limit for benefits had a significant effect on fertility for low-income families. Cuts to local authority funding have also disproportionately fallen on children’s services.
Other broader economic factors have played a role too. The combination of high and rising house prices and rents - driven in part by government policies such as Help to Buy - with stagnant real wages has made it much harder for lower and middle-income young couples to buy a house unless they receive significant financial support from their parents. Given the UK’s cultural norms about homeownership and the nuclear family (or ‘family values’), this makes starting a family much harder. While the UK has made huge strides towards gender equity in the workplace, many state there is still a very large ‘child penalty’ for mothers, with, for example, career progression being hampered. Freelancing and zero-hours contracts may also have contributed to this.
What are the implications? Not a falling population – births are probably now exceeding deaths again, albeit not by much. While the overall population almost certainly did shrink significantly in 2020 as many EU migrants returned home during the Covid pandemic, net migration has become positive again with the taking in of people from Ukraine and Hong Kong in particular, as well as overseas students and their dependents. There are reports in the media that total net immigration could exceed 700,000 for the year 2022 – the figure is expected to be announced next week (probably the reason for Braverman’s talk). Some suggest that the figure for 2023 may exceed 1 million.
Despite what is stated in the media about a shortage of workers, it is unlikely there will be a rapidly rising dependency ratio - indeed, over the next decade, there will still be an increasing number of young people entering the workforce, as the mini-boom of the 2000s works through.
So, is low or a falling fertility rate a problem? The economist Jonathan Portes has written that ‘a country where young people - especially young women - don’t want to have children, because they think they can’t afford it or because they think it’s incompatible with a successful career or a fulfilling life is not one that is delivering the best for its people, either now or for the future’. Sociologists and economists agree that this could have a damaging impact on social cohesion and general wellbeing and on economic dynamism (another Conservative ‘push’). Perhaps the answer is to have policies that make children more affordable, especially for low- and middle-income people? These could include the return of Sure Start centres, building more affordable homes and reducing the child penalties facing mothers in the workplace.
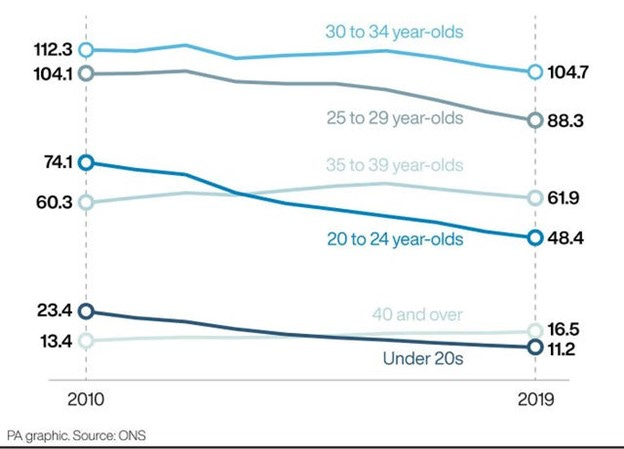
Figure 3. Age specific fertility rates in England and Wales (live births per 1000 women) (2010-2019)