

[Two quick points. I have opened the chat facility on the Substack app – feel free to ask questions or make comments there. Secondly, the number of subscribers is now 2.75k – will I attain 3k by the end of the year?]
Two types of questions that can be asked in the examination papers within the UK are:
· purely knowledge-based questions (AO1) and
· data-stimulus questions which require knowledge/understanding (AO1) but also require application of that knowledge/understanding (AO2) in unfamiliar circumstances – a combination of AO1/AO2 (one Board combines AO2 and AO3, and the questions are very similar). Data is often provided that is new to the student, but they should apply their prior knowledge (from the classroom?) to the new data.
Here are two examples of questions (with a sample answer for each) that illustrate the difference between these two types of questions. The mark and AO allocations are given. The questions match the type of questions for a variety of exam boards – not just one. The context is Changing Places (a Core topic of study).
Knowledge-based questions
Explain how people’s perception of place can vary according to their age. (6 marks)
[6 @ AO1]
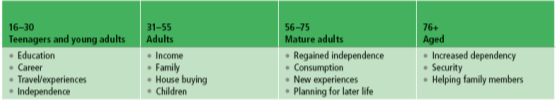
[Does this chart of age groups and their probable life cycle priorities help to answer the above question?]
Life cycle priorities by age – generic.
Answer
People’s perceptions change as they move through their life cycle and their needs change. In your 20s and 30s the inner city could be perceived as a good place to live, it’s close to work and services, but older people perceive suburbs as safer and quieter, and better for families. Young people and even young families might think parks and play areas are positive, but older people can view them as noisy and negative, for example places teenagers may do drugs there or they are dangerous at night.
It depends what people’s priorities are, so safe suburbs with Neighbourhood Watch schemes are good places to bring up children, but closer to the city there are more dangers from traffic and antisocial behaviour so people with young children (the 30 - 40-year-olds) will avoid inner city areas.
Commentary: This is a Level 2 answer – maybe 5 marks out of 6?
Data stimulus questions
These questions assess the assessment objectives AO1 and AO2 (or AO2/AO3) in varying proportions, depending on the exam board. You should demonstrate that you know the factors that underpin the context of the data provided (AO1/AO3), but also apply this knowledge to the question given (AO2). It is important that you refer to the data provided, but then use it as a stimulus to answer the question. In other words, use the data provided as a ‘springboard’.
Note for AQA students only such questions often use the phrase ‘...and your own knowledge’. There is also usually an element of overall assessment or evaluation in the question (involving the use of the command words ‘assess’ or ‘evaluate’). This is part of the AO2 element of the question, and it must be addressed. It is perhaps best addressed by either having a series of mini conclusions at the end of each paragraph, and/or a statement of summative conclusion at the end of the answer.
You usually have about 10/12 minutes to answer these questions. Word length should be 250-350 words.
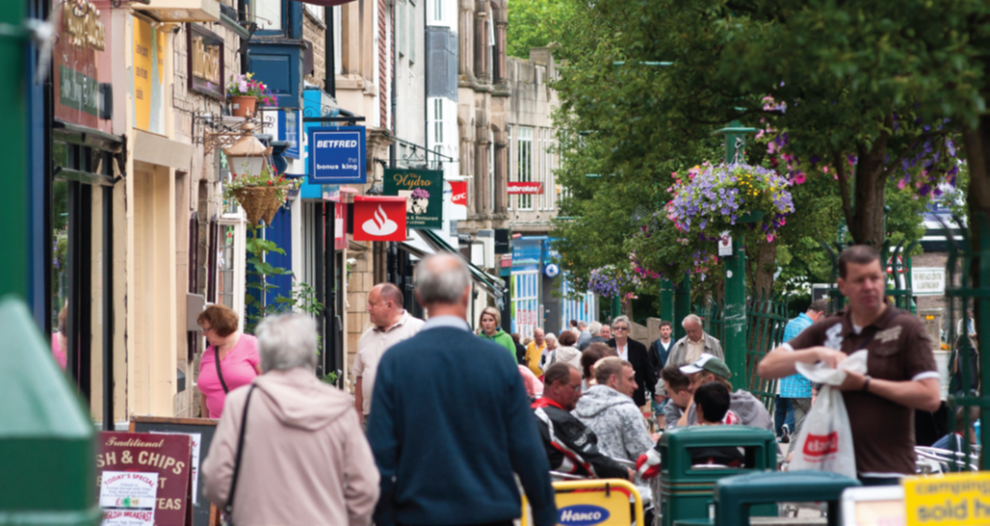
Study Figure 1, which shows formal statistics for a neighbourhood in an English city from the 2011 census, and Figure 2 which shows a photograph taken in the area.
Using evidence from Figure 1 and Figure 2, contrast the formal and informal representations of place. (8 marks)
[4 @ AO1/ 4 @ AO2]
Figure 1
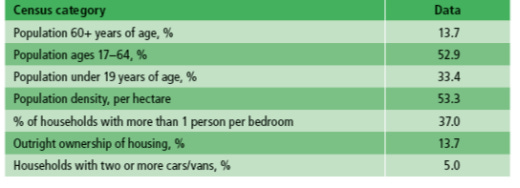
Figure 2
Answer
The census data is generally regarded as accurate because it is done once every 10 years by government and is detailed. However, this census data from 2011 is now out of date and the 2021 census would be more useful. The photo is only a snapshot in time as well, but that date is not known. The census data, even though it is a small LSOA, will be for a much larger area than shown in the photo - so the photo might not be very representative of this LSOA. Photos are very subjective because the taker influences what is shown.
The census data in Figure 1 is mostly demographic data and is very detailed. It suggests this area has a young population and is overcrowded (a high figure (37%) of people sharing a bedroom). But the photo is of a mainly shopping area not a residential area, so Figure 2 and Figure 1 complement each other rather than directly supporting each other. The photo shows an area that seems to have quite old buildings in a reasonable state of repair and has been ‘beautified’ using trees and flowers along the pavement zone – form of regeneration and re-imaging. The census does not record this sort of data.
Something the census cannot show is the local-ness of the place, such as the variety of shops some of which are the same everywhere – Betfred, Santander and KFC (as shown in the photo), and the waste disposal measures like the green bins. This is why the two types of data are better together.
In summary, the photograph is visual and qualitative (informal), and this provides a context for the quantitative numerical data (formal) from the census. (283 words)
Commentary. How good is this answer? Top Level – marks? Over to you.
thank you always nice to get answers to discus