
Urban air pollution

[While clueless Trump struggles to get himself out of a conflict he started …..
The impact of physical geography is significant in the current situation in the Strait of Hormuz – the narrowness of the seaway having a major effect on the movement of ships and goods. However, the role of physical geography in this region is even more important when considering future alternative ways to get oil and gas out to markets. This recent piece in The Conversation explains why.
In the study of Changing Places, urban art often gives an interesting take on how people feel within that place – their identity. Perhaps the best-known protagonist of urban art is Banksy. This piece by former BBC journalist Nick Bryant tells an interesting story about Banksy.]
Introduction
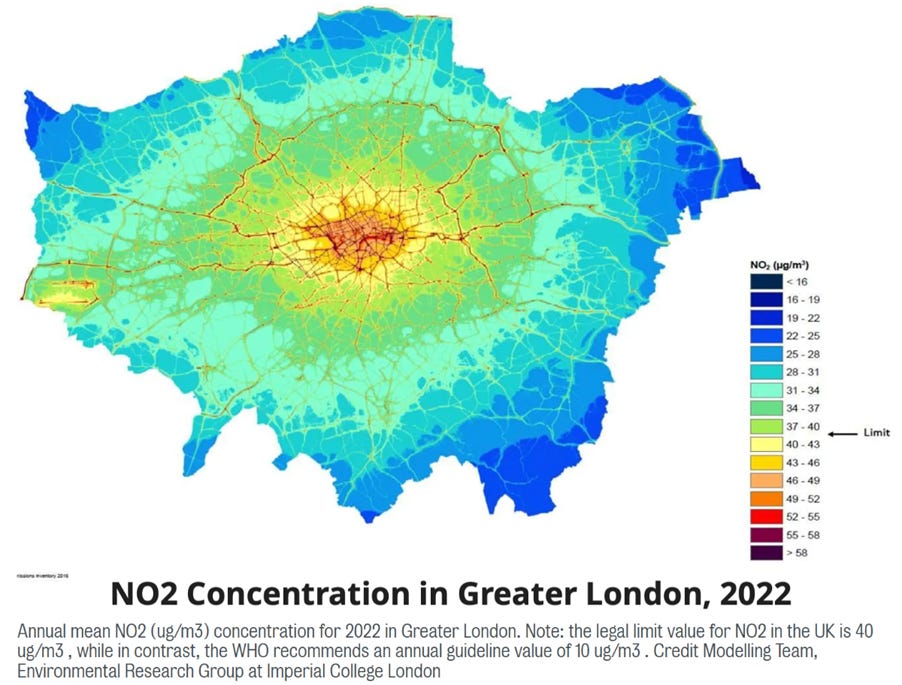
A recent study from King’s College London found that exposure to air pollution during the first stages of pregnancy is associated with delayed speech and language development in babies. Researchers studied 498 infants in Greater London from 2015 to 2020 and found that those exposed to higher levels of pollutants like nitrogen dioxide (NO₂) and fine particulate matter (PM2.5 and PM10), primarily from vehicle emissions, scored about 5 to 7 points lower on language assessments at around 18 months. Premature infants with the highest exposure levels scored on average 11 points lower.
Researchers found no significant association between pollution exposure and language outcomes during the later stages of pregnancy.
Air quality in urban areas
Air quality is a direct reflection of the extent to which there is atmospheric pollution. The amount of air pollution in the atmosphere depends on the rate at which pollutants are produced and the rate at which they are dispersed (diluted) as they move away from their source.
In the UK, the Department for Environment, Food and Rural Affairs (Defra) provides a summary index of the total amount of pollution in the UK atmosphere. It covers the five key atmospheric pollutants which are likely to have an impact on health. These are:
• ozone (O3)
• nitrogen dioxide (NO2)
• sulphur dioxide (SO2)
• particulate matter (as PM10) from exhausts, cement dust, tobacco smoke and ash
• fine particulate matter (as PM2.5).
Concentrations vary in time and space, because of variability in the sizes and locations of polluting sources. For example, in most cities a significant local source of air pollution is traffic emissions. These vary significantly depending on factors including:
· the volume and speed of traffic
· the types and proportions of vehicles (buses, lorries, cars, motorbikes, etc.)
· the age and level of maintenance of vehicles
· the temperature of the engine and fuel type used.
The geography of the urban built environment (such as the height of buildings and how close they are to the road, the width of the road and shape of the road network, local topography and presence of vegetation) can also affect air-pollution concentrations. This means that the highest concentrations are not only found where the emissions are highest, but also in areas where pollutants get trapped and do not disperse effectively. Such pollutant hotspots move around over time - a hotspot observed during morning rush hour may not be found at the same place during the evening rush hour.
It is difficult to determine the exact health effects of exposure to specific air pollutants. This is because we are continually exposed to a mixture of pollutants, sometimes called a pollutant ‘soup’. Exposure to high concentrations of pollutants often occurs at the same time as weather extremes (very hot or very cold temperatures) which impact on health and on people’s behaviour (whether they choose to exercise outdoors, how they travel to work, etc.). Generally, we expect long-term exposure to low or moderate levels of air pollution to result in chronic health effects, while short-term exposure to high concentrations is likely to cause more serious immediate health consequences. The moderate levels of air pollution which we experience in the UK today impact most on people who already have heart and lung conditions or have an increased vulnerability due to age or ill health.
We experience our highest levels of air pollutants when we are moving through urban spaces, generally while commuting to and from work. This means that, although we might spend less than 10% of our day commuting, it may account for more than 50% of our total exposure to air pollution.
Photochemical smog
This is the result of a chemical reaction between sunlight and nitrogen oxides (NOx) and leads to high levels of ozone in the lower atmosphere. This can be the cause of health problems (headaches, eye irritation, coughs and chest pains) as well as being damaging to vegetation. Los Angeles has had a serious problem with photochemical smog because of its high density of vehicles, frequent sunshine and the favourable topography that traps the high concentration of photo-oxidant gases at low levels. European cities have seen a growth in photochemical smog in the second half of the twentieth century particularly when anticyclonic conditions prevail that can trap the pollutants at low levels. Athens is often quoted as the worst sufferer in Europe, but conditions can be equally bad in other cities, such as London and Paris.
Pollution reduction policies
There are several ways in which governments (local and national) have tried to reduce atmospheric pollution in cities.
(a) Clean Air Acts: after the London ‘peasouper’ smog of 1952, the UK government decided that legislation was needed to prevent the amount of smoke entering the atmosphere. The Act of 1956 first introduced smoke-free zones into the UK’s urban areas which slowly began to clean up the air. This early Act has been reinforced by further legislation. In the 1990s, for example, very tough regulations were imposed on levels of airborne pollution, particularly on the level of PM10s in the atmosphere. Local councils in the UK are now required to monitor pollution in their areas and establish Air Quality Management Areas where levels are likely to be exceeded, and some have planted more vegetation to capture particulates on leaves.
(b) Vehicle control in inner urban areas: several cities have looked at ways on controlling pollution by trying to reduce the number of vehicles that come into central urban areas. In Athens, for example, the city declared an area of about one square mile in the centre to be traffic free. Many British towns and cities have pedestrianised their CBDs. In London, attempts to control vehicle numbers have been made by bringing in a congestion charge (a road toll) which means that vehicle owners will have to pay if they wish to drive into the centre.
(c) More public transport: attempts have been made to persuade more people to use public transport rather than bring their cars into the city. Such schemes have included Manchester’s development of a tram system (Metrolink), the development of bus-only lanes into city centres, the growth of park-and-ride schemes in many British cities and the encouragement of car sharing schemes.
(d) zoning of industry: industry has been placed downwind in the city if possible and planning legislation has forced companies to build higher factory chimneys to emit pollutants above the inversion layer;
(e) Vehicle emissions legislation: motor vehicle manufacturers have been forced to develop better fuel burning engines and introduce catalytic converters which remove some of the particulates from exhaust fumes. The switch to lead free petrol has also brought about cleaner air. In 2008, London introduced the Greater London Low Emission Zone (LEZ) within which the most polluting vehicles are required to pay a daily charge for being within that area. The aim is to improve the air quality of the air in the city. The ULEZ then followed (see below).
(f) The rapid growth of electric vehicles will have an increasingly diminishing effect on vehicle emissions.
Finally, a short quiz (Answers follow after the photo)
1. Which global governance body publishes threshold standards for urban air pollution?
2. Which form of air pollution is estimated to kill 1.5–1.7 million people per year, almost half of them children under 5 years old?
3. Urban air pollution often focuses on particulate matter called PM10 or PM2.5. What do the numbers 10 and 2.5 refer to?
4. Many modern diesel vehicles use a liquid called ‘AdBlue’, which is injected into the car exhaust. Which pollutant is this designed to reduce?
5. What air pollution management measure was introduced in London in April 2019?
6. Which continent has the highest levels of urban air pollution?
7. Which potential air pollutant is sometimes described as being ‘good up high but bad nearby’?
8. Globally, how many deaths are attributed to outdoor air pollution each year?
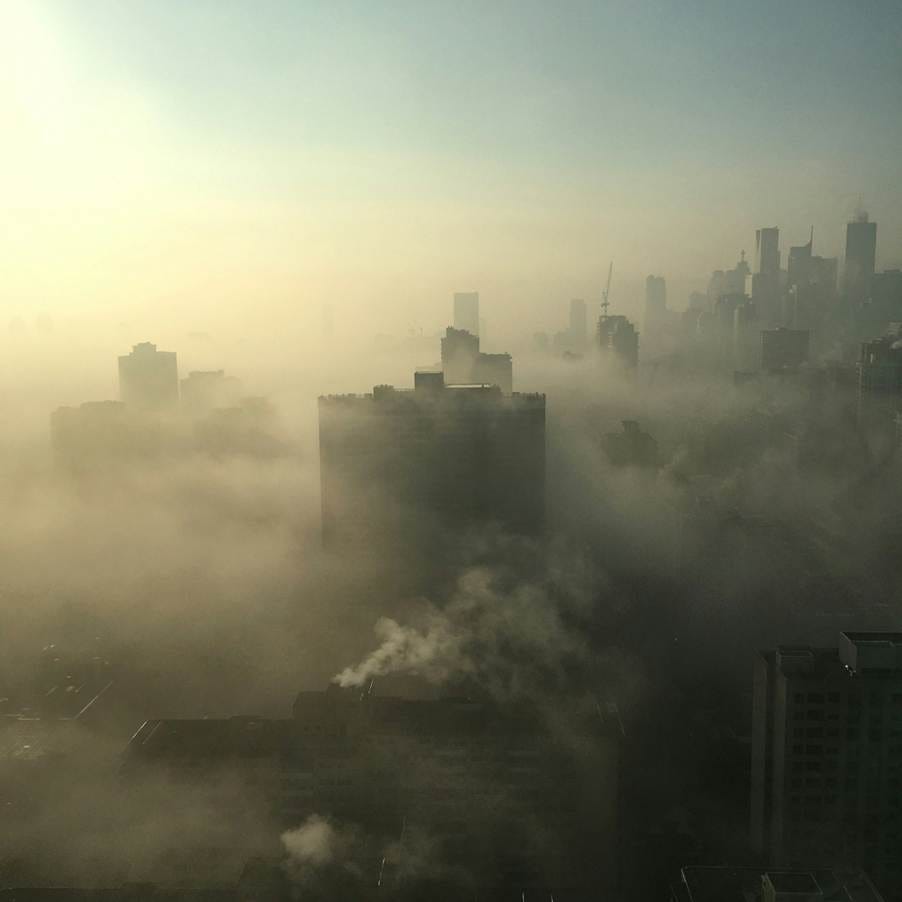
Photo (Toronto): Kristin Morith (Unsplash)
Answers
1 The WHO - since 1987 the World Health Organization (part of the UN) has published guidelines for the safe level of particulate matter, low-level ozone, nitrogen dioxide and sulphur dioxide.
2 Indoor household air pollution. This particularly affects households in developing countries where cooking indoors uses open fires and inefficient wood or charcoal stoves. Women and children are the most badly affected.
3 Particle size in microns. A micron, or micrometre, is 1/1000th of a millimetre. PM2.5 particles are 0.0025 mm in size and because of their tiny nature, can travel deep into the lungs causing cancer, asthma and coronary disease.
4 Nitrogen oxides (NOx). AdBlue is a form of diesel exhaust fluid (DEF) made of urea and water. It converts NOx into nitrogen by a process called Selective Catalytic Reduction (SCR). NOx emissions from diesel engines are a major source of urban air pollution.
5 The Ultra-Low Emission Zone or ULEZ. Congestion charging in London was first introduced in 2003. The ULEZ charge (£12.50 for cars) applies to vehicles that do not meet certain emissions standards. Pollution in central London fell by 20% following the launch of the ULEZ.
6 Asia. Based on WHO databases measuring PM10 and PM2.5 pollution in the worst 500 cities for air pollution, over 300 of the worst cities were in China and over 50 in India. In Europe, cities in Poland and Italy tend to have the highest PM pollution levels.
7 Ozone. Ozone (O3, or a molecule with 3 oxygen atoms) is present ‘up high’ in the stratosphere where it filters out harmful UV-light within the ozone layer. However low-level ozone (‘bad nearby’) is an urban air pollutant that leads to respiratory problems.
8 The WHO estimates 4.5 million deaths are attributed to outdoor air pollution. However, 9 out of 10 people worldwide breathe air that is polluted in some way and tens of millions have reduced quality of life and reduced life expectancy due to outdoor air pollution.