Why it is time to ditch the Bradshaw model.
At best it is flawed; at worst it is wrong.
What is the Bradshaw model?
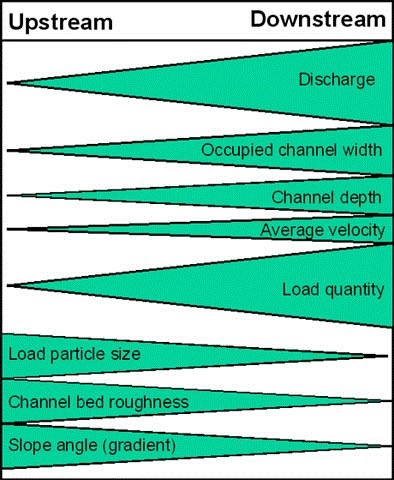
For the two or three of you who don’t know, the Bradshaw model (BM) describes the changes in a river’s characteristics that occur between its source and its mouth. It is normally depicted as a series of triangles (Figure 1) which state:
· discharge, channel width, channel depth, average velocity, and quantity of load increase with distance downstream.
· particle size, channel bed roughness and gradient downstream decrease with distance downstream.
Figure 1. The Bradshaw model
The model’s origins
The model first appeared as an illustration in M. J. Bradshaw's secondary school textbook The Earth's Changing Surface (1978). Michael Bradshaw was a senior lecturer in geography and geology at the College of St Mark and St John in Plymouth, a teacher-training college. Its origins however go further back from this date. It was roughly based on the work of Leopold, Wolman, and Miller (LWM) in the 1950/60s. They studied how the characteristics of the Mississippi/Missouri rivers varied from source to mouth, and over several years. Their results were published in their book Fluvial processes in geomorphology (1964). [In the book Luna Leopold is photographed doing fieldwork in a characteristic Stetson hat]. Schumm simplified their results in his book The Fluvial System, and then Bradshaw then grossly oversimplified his work. The BM became the go-to model for much smaller rivers/streams over much shorter distances, and over shorter time scales. The difference in context could not be greater.
So, to be clear:
· the model is based on a full drainage basin study – source to mouth; not a few hundred metres, or even a kilometre.
· in the UK, there are few places where this is possible in a fieldwork context, mainly on the west coast of England, or west Wales. The best example I have seen was fieldwork based on the River Neb on the west coast of the Isle of Man – the entire drainage basin was visited on the same day.
· LWM’s work was based on data collected over a long period of time, several years.
· in fieldwork terms, the number of sampling sites needs to be worthwhile – a minimum of 4 or 5 sites down the river.
Why is the model flawed?
One significant weakness is that the changes in the variables in the model are inevitable and interdependent. What river does not get wider, deeper, capable of carrying more water (discharge) and material (load) as it goes downstream? Consequently, a river can erode its load more (it gets smaller) and deposit more (channel roughness declines). These are all a consequence of increasing stream energy – the ability of a river to complete work. Do rivers flow uphill? No, so gradient declines. These variables are all patently obvious – why measure them?
Another point to note about the original Bradshaw model is the relative size of each of the triangles describing the channel variables (in some later versions of the model the proportions of these have been lost). Load and discharge show the biggest changes from upstream to downstream, whereas slope, bed roughness and velocity change relatively little.
Why is the model wrong?
Bradshaw clearly got carried away and introduced a variable that LWM (or Schumm) did not suggest – that velocity increases from source to mouth (see Figure 1 again). Perhaps he thought that as stream energy increases downstream, so must velocity? The link is of course to discharge. How many thousands of students over the years have lost corks, dog biscuits, oranges, flowmeters, friends.... to measure the supposed variation in velocity from one river section, separated by a few hundred yards, to another? How many have suffered hypothermia as a result?
Furthermore, it is unlikely that the flow conditions being measured on the day on which the fieldwork takes place will represent conditions under which channel characteristics are formed. Most sediment transport occurs during high flows that happen only once or twice a year and are too dangerous for fieldwork. River fieldwork usually occurs at safer low flows when the water in the stream is not strong enough to move anything (other than a dog biscuit etc.). In other words, the ‘dominant discharge’ creating the channel is high flow, not the low flow that is usually encountered.
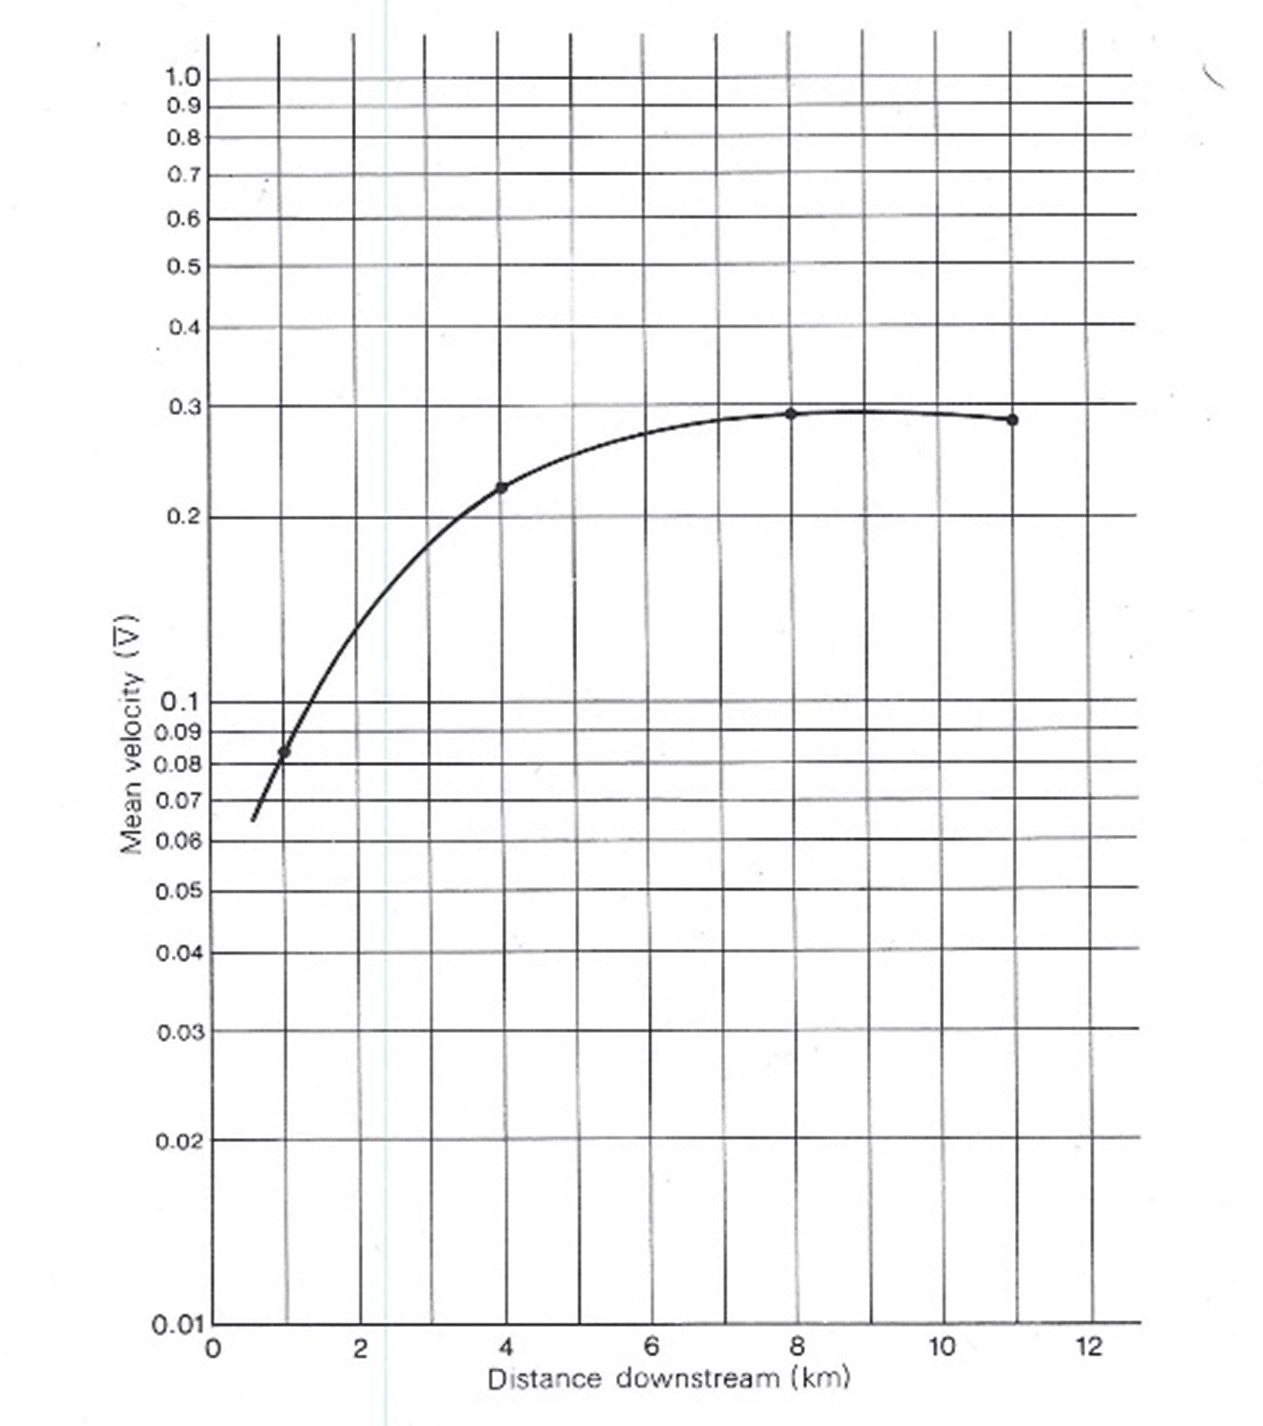
Figure 2 illustrates the outcomes of fieldwork on the Afon Clarach in west Wales. The river is relatively short in length and so can be visited in one day. Note how the velocity (in cumecs) rises rapidly in the earlier section of its course (as per the BM to be fair) but then the increase in velocity reduces and then velocity slightly decreases as it enters the sea in Cardigan Bay. This is not the outcome that the BM suggests.
Figure 2. Afon Clarach, Dyfed, Wales. Velocity changes downstream
Finally…
It should also be noted that there are many individual variations in the characteristics of any single drainage basin (e.g. geology, vegetation, climate, slope) that affect stream characteristics which mean that the measured stream may not closely match such a theoretical model. Some may use this to justify their river fieldwork – in which case they should collect data on those aspects too. How many people do this?


Completely agree. Apart from anything else there is too much fieldwork that seems intent on proving Bradshaw to be true. Finds out (unsurprisingly) that it isn't true for that short stretch of river and then students are invited to conclude their methods and measurements must be wrong. It teaches bad fieldwork habits and techniques.
Plus, rivers are so interesting there is so much more interesting fieldwork to be done.
Totally agree the BM is flawed - but it is great for GCSE students as the brightest will pick up on it in their evaluation.......